Open Access, Peer-reviewed
eISSN 2093-9752

Open Access, Peer-reviewed
eISSN 2093-9752
Paudel Dinesh
Jin-Ho Back
http://dx.doi.org/10.5103/KJSB.2021.31.3.176 Epub 2021 October 14
Abstract
Objective: The purpose of this study is to investigate whether the athletic knee show greater rotation and translation movement than non-athletic knee during the treadmill walking with their preferred speed in a complete gait cycle.
Method: Thirty young and healthy male subjects participated in the study, fifteen handball players (mean age: 19.6 ± 1.4 years old, mean weight: 85 ± 11.9 Kg, mean height: 179.8 ± 4.7) and fifteen non-athletes (mean age: 22.8 ± 1.2 years old, mean weight: 74.5 ± 8.6 Kg, mean height: 175 ± 5.9). Three-dimensional positional coordinate of lower limb during treadmill walking were analyzed.
Results: There were significant differences (t (22.014)=1.585, p=0.127 in the range of internal and external rotation with mean value for handball player (M=14.4513, SD=2.3839) was higher than non-athletes (M= 13.3327, SD=1.337). The magnitude of the difference in the means (mean difference=1.11867, 95% CI: -0.34489 to 2.5822) was significant. There were also significant differences (t (17.956)=1.654, p=0.116 in the max abduction and adduction with mean value for handball player (M=5.7160, SD=2.49281) was higher than non-athletes (M=4.5773, SD=0.94667). The magnitude of the difference in the means (mean difference=1.138, 95% CI: -0.30805 to 2.58539) was significant. At significance level 0.05.
Conclusion: Finding of this study suggest that to understand the actual characteristic of knee motion studies have to be done in different walking and running trial at variable speed.
Keywords
Knee Movement Rotation Translation Kinematics Gait cycle
Knee joint is the biggest joint of the human body having both mobility and stability. Rotational and translational movement of the knee occurs in six degrees of freedom. Rotational movements flexion/ extension, abduction/adduction and internal/external occurs in sagittal plane, frontal plane and transverse plane respectively. There are three translational movement of tibia with respect to femur, proximal/distal translation, medial/lateral translation and anterior/posterior translation. (Andriacchi, Alexander, Toney, Dyrby & Sum, 1998). In an athletic en- deavour most of the injuries are associated with lower extremities with knee being predominant (Van Mechelen, 1992). Actual characteristics of tibiofemoral movement helps to understand the complex mechanics of the knee (Akbarshahi et al., 2010) and also quantify the human gait characteristics (Levine, Richards & Whittle, 2012).
Different methods and systems have been implemented to study the knee joint kinematics, however the motion pattern of the tibiofemoral joint itself are still discussed controversially (Postolka et al., 2020). Most of the studies on knee kinematics in sagittal plane are widely described and accepted while the studies on transverse and frontal plane have reported fluctuating ROM (Clément et al., 2018). Only few studies have focused on the translation movement in the knee joint (Dennis et al., 2001; Gray et al., 2019; Komistek, Dennis & Mahfouz, 2003; Koo & Andriacchi, 2008; Kozanek et al., 2009; Liu et al., 2021; Postolka et al., 2020). Optical motion capture system, sensors and fluoroscopic analyses are being used to study the knee kinematics. Very few researches have been done to study knee kinematics in six degrees of freedom by using Opti track motion capture system. On the other hand, studies are only confined to stance phase or swing phase of the gait cycle, only number of studies has studied knee kinematics in complete gait cycle.
It is a well-known fact that athletic knee is more robust than the non-athletic knee and various studies had been performed to measure the knee strength of athletes. Most of the studies has compare the athletes and non-athletes' knee in different jumping and squatting event. Further many comparative studies have been done to study knee kinematics in healthy and unhealthy knee. To our knowledge there are not any studies which has compare the knee kinematics in six degrees of freedom for athletes and non-athletes during treadmill walking.
Handball is a fast and dynamic game in which player performs the repeated accelerations, sprints, jumps, shots, rapid change of direction, and a high number of physical confrontations with opponent players. (Michalsik, Aagaard & Madsen, 2015). Handball players perform at least 48,000 throwing motions in season of practice and competition (Almeida et al., 2013). In all these events active participation of knee is essential with rotational and translation movement.
Thus, the objective of this study is to investigate whether the athletic knee show greater rotation and translation movement than non-athletic knee during the treadmill walking with their preferred speed. Further this study also wants to compare the 3D knee kinematics of handball player and the non-athletes during treadmill walking with their preferred speed in different event of complete gait cycle.
1. Participants
Thirty male participants of Kangwon National University, Samcheok campus voluntarily participated in the study: fifteen handball players (mean age: 19.6±1.4 years old, mean weight: 85±11.9 Kg, mean height: 179.8±4.7) and fifteen non-athletes (mean age: 22.8±1.2 years old, mean weight: 74.5±8.6 Kg, mean height: 175±5.9). Participants had no previous history of medical injury that could affect the natural gait. The participants were trained to walk on treadmill and were explained about the experimental procedure and purpose of the study. Participants walked on treadmill with their preferred speed, handball player (4.44±0.45 km/h) and non-athletes (2.64±0.64 km/h).
2. Experimental equipment
Kinematic data were collected using Opti-track motion capture system (motive 2.1.1) with six cameras (prime X 13). Camera calibration and ground plane setting were performed using CW-500 calibration wand kit and calibration square CS-400 respectively. Treadmill was setup in the capture area for the walking. Retro-reflective markers were attached to motion capture suit classic bilaterally to the greater trochanter, lateral and medial plateau, lateral and medial femoral epicondyle, lateral and medial malleolus, anterior superior iliac spine, posterior superior iliac spine, 1st and 5th metatarsal and the heel. The suit is breathable and markers can be attached to any of the Velcro friendly surfaces for custom marker set and skeleton.
3. Procedure
Preliminary phase of experiment started by introducing the subjects about the experiment, equipment and the way of performing. Subjects were made familiar to walk on treadmill wearing experimental suit. Cameras were adjusted in the designated areas such that they can capture each and every marker attached in the body of the subjects and the camera frame rate was set to 120 Hz. Any external noise or disturbances were removed. After that camera calibration was per- formed by repeatedly moving calibration wand kit in the capture area. Then after ground plane was set by using the calibration square. After- wards retroreflective markers were placed in the bony land marks of the body. Afterwards static posture file was collected to define the position and orientation in the space of the body segment. Then the process of data capture began for which each subject walked on treadmill with their preferred speeds.
4. Data collection and analysis
Three-dimensional coordinate of the retroreflective markers attached to the lower extremity joints were obtained after labelling and gap filling of the trajectories of markers. Smoothing feature available in the edit tools of the software (Opti-track motion capture system) was used to remove the disturbances in the data by applying the cut off frequency of 6 Hz. Smoothing feature applies a noise filter (Butterworth 4th low-pass filter). For quantifying gait cycle at first position time graph of heel and toe marker were analyzed. All data processing, analyzing and script coding were performed in MATLAB (MATLAB R2021a).
5. Events and phases
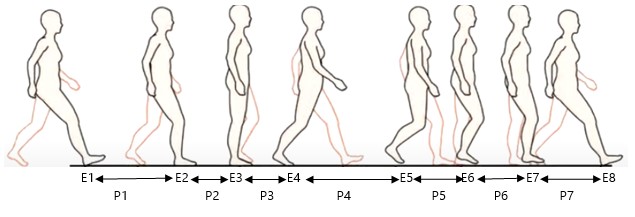
For the study of rotational and translational movement in a complete gait cycle, we divided the walking in eight events and 7 phases which is illustrated in (Figure 1).
1) Events
(1) Event1 (E1): when heel of the right foot contacts the floor
(2) Event2 (E2): flat foot condition of the right foot
(3) Event3 (E3): when femur of the right leg is in vertical position
(4) Event4 (E4): heel off of the right foot
(5) Event5 (E5): toe off of the right foot
(6) Event6 (E6): maximum flexion of the right knee
(7) Event7 (E7): when tibia of the right leg is in vertical position
(8) Event8 (E8): Terminal contact by the heel of the right foot
2) Phases
(1) Phase1 (P1): E1 ~ E2
(2) Phase2 (P2): E2 ~ E3
(3) Phase3 (P3): E3 ~ E4
(4) Phase4 (P4): E4 ~ E5
(5) Phase5 (P5): E5 ~ E6
(6) Phase6 (P6): E6 ~ E7
(7) Phase7 (P7): E7 ~ E8
TOTAL: from initial contact of the right heel to the terminal contact of the right heel. As a whole E1 to E4 represents the stance phase and E5 to E8 represents the swing phase of gait cycle.
6. Statical analysis
To determine the significant difference in dynamic knee motions between the handball player and non-athletes' group Independent samples t-test was performed. Level of significance was set to 0.05. Statical analysis was done by using (IBM SPSS statistics 25).
Max value, min value and ROM in the complete gait cycle were calculated for the rotation movement of the knee joint which are presented in (Table 1). Average rotation movement in a complete gait cycle at different event are presented in (Figure 2, Figure 3, and Figure 4).
|
Rotational movements |
|
Handball |
Non- |
|
Flexion (+) / |
Max |
64.95±2.4 |
60.93±2.9 |
|
Min |
1.14±3.8 |
1.17±4.12 |
|
|
ROM |
62.38±2.37 |
60.73±3.45 |
|
|
Abduction (+) / |
Max |
5.71±2.49 |
4.57±0.94 |
|
Min |
-3.73±1.31 |
-4.35±1.36 |
|
|
ROM |
10.18±1.96 |
9.1±2.09 |
|
|
Internal (+) / |
Max |
9.61±2.61 |
8.31±2.38 |
|
Min |
-3.66±3.33 |
-3.31±4.02 |
|
|
ROM |
14.45±2.38 |
13.33±1.33 |
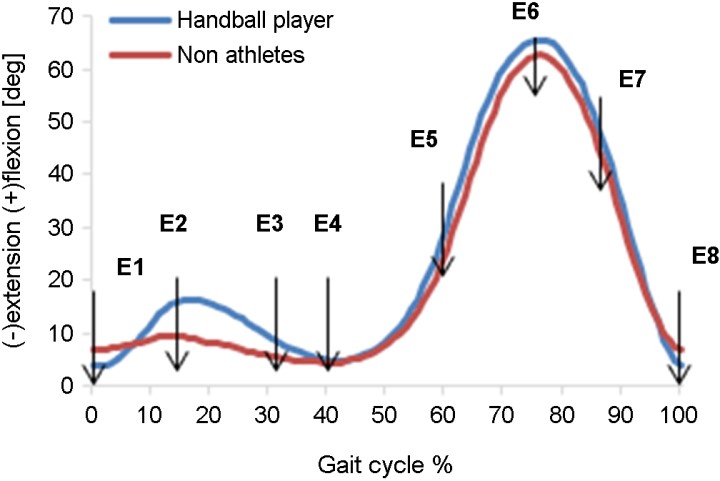
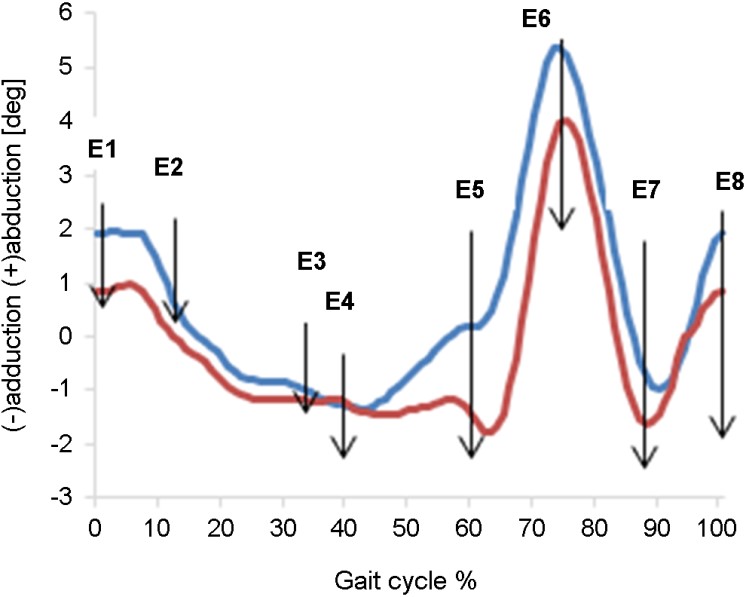
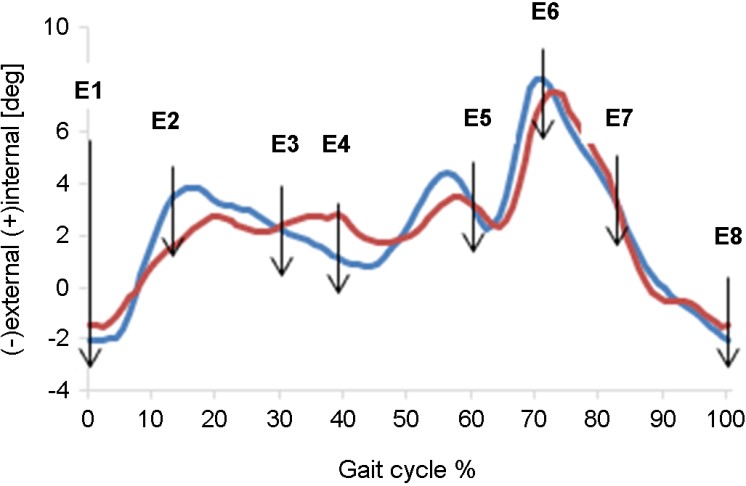
As we can see in (Table 1) the max value for flexion and extension is slightly higher for the handball player than the non-athletes. However, there are very small differences in abduction/adduction and internal/ external rotation movement.
Max value, min value and ROM in the complete gait cycle were calculated for the translation movement of the knee joint which are presented in (Table 2). Average translation movement in a complete gait cycle at different event are presented in (Figure 5, Figure 6, Figure 7).
|
Translation movement |
|
Handball |
Non- |
|
Proximal (+) / |
Max |
23.4±3.26 |
21.23±2.81 |
|
Min |
-8.75±2.72 |
-5.93±4.08 |
|
|
ROM |
27.73±3.73 |
24.38±3.38 |
|
|
Anterior (+) / |
Max |
11.47±3.34 |
10.64±2.75 |
|
Min |
-4.39±3.56 |
-4.19±2.84 |
|
|
ROM |
15.38±2.44 |
12.60±2.68 |
|
|
Lateral (+) / |
Max |
8.46±2.63 |
6.27±2.19 |
|
Min |
-5.96±2.36 |
-6.18±2.07 |
|
|
ROM |
12.43±2.09 |
10.88±1.39 |
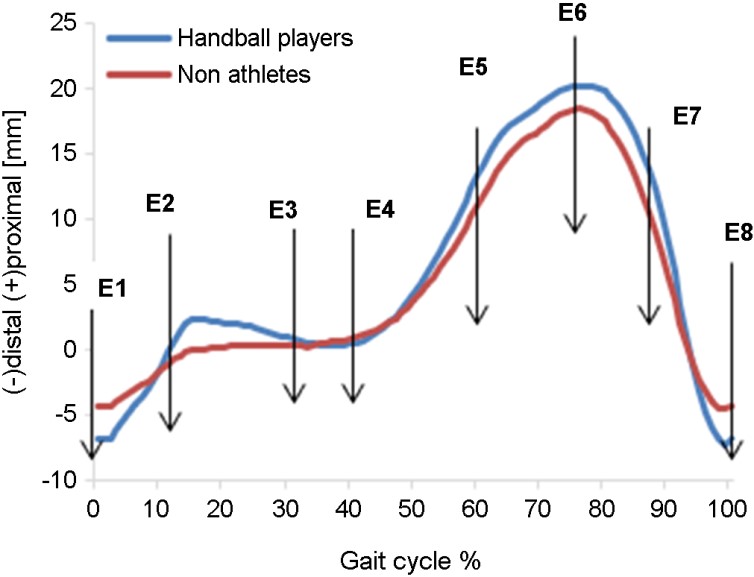
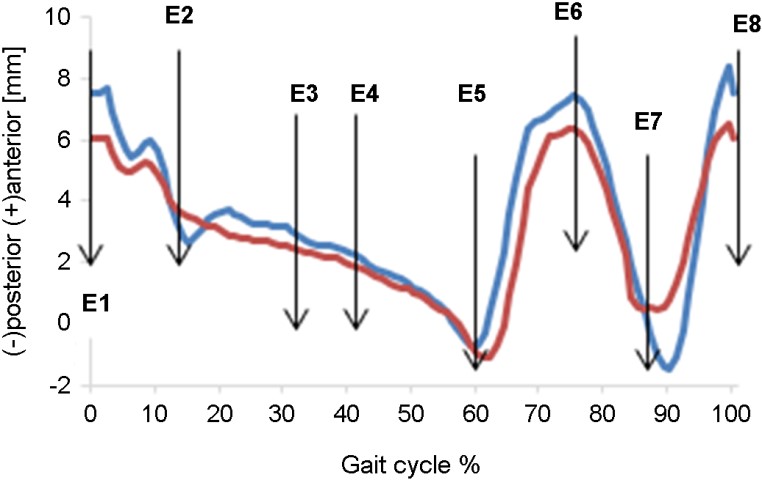
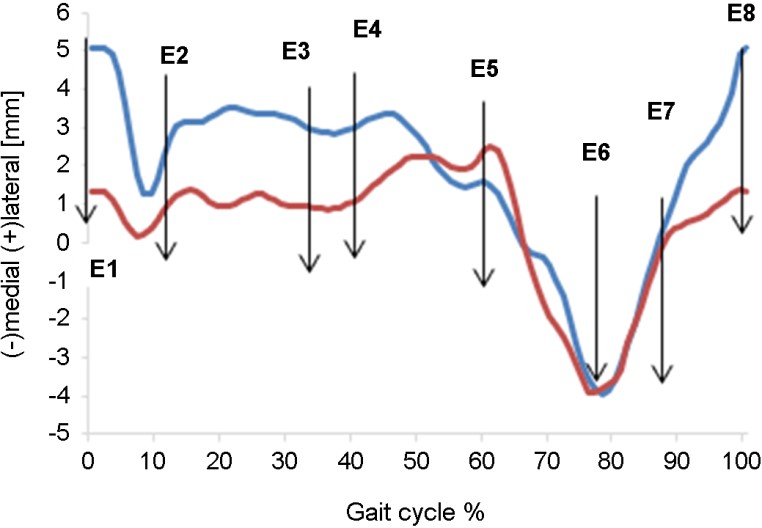
As we can see in (Table 2) Max, Min and ROM for different translatory movement of tibia with respect to femur shows the slight difference of 2 mm to 3 mm for handball player and non-athletes.
Result of independent samples t-test for the rotation movement of the knee joint is presented in (Table 3) shows that there were significant differences (t (22.014)=1.585, p=0.127 in the range of internal and external rotation with mean value for handball player (M=14.4513, SD= 2.3839) was higher than non-athletes (M=13.3327, SD=1.337). The difference of magnitude (mean difference=1.11867, 95% CI: -0.34489 to 2.5822) was significant. There were also significant differences (t (17.956) =1.654, p=0.116 in the max abduction and adduction with mean value for handball player (M=5.7160, SD=2.49281) was higher than non-athletes (M=4.5773, SD=0.94667). The difference of magnitude in the means (mean difference=1.138, 95% CI: -0.30805 to 2.58539) was significant.
|
|
F |
Sig. |
t |
df |
Sig. |
Mean |
Std. error |
95% Confidence interval |
||
|
Lower |
Upper |
|||||||||
|
Max flexion or |
EVA |
.403 |
.531 |
4.025 |
28 |
.000 |
4.02133 |
.99905 |
1.97487 |
6.06780 |
|
EVNA |
|
|
4.025 |
26.963 |
.000 |
4.02133 |
.99905 |
1.97132 |
6.07135 |
|
|
Min flexion or |
EVA |
.774 |
.387 |
-.019 |
28 |
.985 |
-.02733 |
1.45498 |
-3.00772 |
2.95305 |
|
EVNA |
|
|
-.019 |
27.850 |
.985 |
-.02733 |
1.45498 |
-3.00844 |
2.95378 |
|
|
ROM during flexion |
EVA |
3.451 |
.074 |
1.523 |
28 |
.139 |
1.64867 |
1.08247 |
-.56868 |
3.86602 |
|
EVNA |
|
|
1.523 |
24.838 |
.140 |
1.64867 |
1.08247 |
-.58147 |
3.87880 |
|
|
Max internal and |
EVA |
.284 |
.598 |
1.426 |
28 |
.165 |
1.30267 |
.91338 |
-.56831 |
3.17364 |
|
EVNA |
|
|
1.426 |
27.758 |
.165 |
1.30267 |
.91338 |
-.56905 |
3.17438 |
|
|
Min internal and |
EVA |
.702 |
.409 |
-.259 |
28 |
.797 |
-.35000 |
1.34906 |
-3.11343 |
2.41343 |
|
EVNA |
|
|
-.259 |
27.064 |
.797 |
-.35000 |
1.34906 |
-3.11775 |
2.41775 |
|
|
ROM during internal |
EVA |
5.823 |
.023 |
1.585 |
28 |
.124 |
1.11867 |
.70574 |
-.32697 |
2.56430 |
|
EVNA |
|
|
1.585 |
22.014 |
.127 |
1.11867 |
.70574 |
-.34489 |
2.58222 |
|
|
Max abduction and |
EVA |
8.566 |
.007 |
1.654 |
28 |
.109 |
1.13867 |
.68849 |
-.27164 |
2.54897 |
|
EVNA |
|
|
1.654 |
17.956 |
.116 |
1.13867 |
.68849 |
-.30805 |
2.58539 |
|
|
Min abduction and |
EVA |
.019 |
.890 |
1.259 |
28 |
.219 |
.61467 |
.48837 |
-.38571 |
1.61504 |
|
EVNA |
|
|
1.259 |
27.966 |
.219 |
.61467 |
.48837 |
-.38577 |
1.61510 |
|
|
ROM during abduction |
EVA |
.173 |
.681 |
1.455 |
28 |
.157 |
1.07933 |
.74195 |
-.44048 |
2.59915 |
|
EVNA |
|
|
1.455 |
27.871 |
.157 |
1.07933 |
.74195 |
-.44080 |
2.59946 |
|
|
Note: EVA (Equal variance assumed), ENVA (Equal variance not assumed) |
||||||||||
Result of independent samples t-test for the translation movement of the tibia with respect to femur is presented in (Table 4). No significant differences were found in translation movement at significance level 0.05. There were slight differences of 2 mm to 3 mm for Max, Min and ROM for different translatory movement of tibia with respect to femur however no significant difference was found during statical analysis.
|
|
F |
Sig. |
t |
df |
Sig. |
Mean |
Std. error |
95% Confidence interval |
||
|
Lower |
Upper |
|||||||||
|
Max proximal and |
EVA |
.598 |
.446 |
1.946 |
28 |
.062 |
2.16800 |
1.11424 |
-.11443 |
4.45043 |
|
EVNA |
|
|
1.946 |
27.403 |
.062 |
2.16800 |
1.11424 |
-.11667 |
4.45267 |
|
|
Min proximal and |
EVA |
.411 |
.527 |
-2.220 |
28 |
.035 |
-2.81400 |
1.26770 |
-5.41076 |
-.21724 |
|
EVNA |
|
|
-2.220 |
24.367 |
.036 |
-2.81400 |
1.26770 |
-5.42831 |
-.19969 |
|
|
ROM in proximal and distal translation |
EVA |
.375 |
.545 |
2.574 |
28 |
.016 |
3.34713 |
1.30031 |
.68357 |
6.01070 |
|
EVNA |
|
|
2.574 |
27.734 |
.016 |
3.34713 |
1.30031 |
.68242 |
6.01185 |
|
|
Max lateral and |
EVA |
.297 |
.590 |
2.475 |
28 |
.020 |
2.19133 |
.88534 |
.37780 |
4.00486 |
|
EVNA |
|
|
2.475 |
27.112 |
.020 |
2.19133 |
.88534 |
.37512 |
4.00754 |
|
|
Min lateral and |
EVA |
.322 |
.575 |
.272 |
28 |
.788 |
.22067 |
.81120 |
-1.44101 |
1.88234 |
|
EVNA |
|
|
.272 |
27.526 |
.788 |
.22067 |
.81120 |
-1.44230 |
1.88363 |
|
|
ROM in lateral and |
EVA |
3.882 |
.059 |
2.397 |
28 |
.023 |
1.55780 |
.64986 |
.22662 |
2.88898 |
|
EVNA |
|
|
2.397 |
24.367 |
.025 |
1.55780 |
.64986 |
.21763 |
2.89797 |
|
|
Max anterior |
EVA |
1.316 |
.261 |
.743 |
28 |
.464 |
.83100 |
1.11889 |
-1.46094 |
3.12294 |
|
EVNA |
|
|
.743 |
27.011 |
.464 |
.83100 |
1.11889 |
-1.46473 |
3.12673 |
|
|
Min anterior |
EVA |
.736 |
.398 |
-.168 |
28 |
.868 |
-.19800 |
1.17885 |
-2.61276 |
2.21676 |
|
EVNA |
|
|
-.168 |
26.690 |
.868 |
-.19800 |
1.17885 |
-2.61811 |
2.22211 |
|
|
ROM during anterior |
EVA |
.538 |
.469 |
2.969 |
28 |
.006 |
2.78467 |
.93776 |
.86375 |
4.70559 |
|
EVNA |
|
|
2.969 |
27.771 |
.006 |
2.78467 |
.93776 |
.86303 |
4.70630 |
|
In this study we calculate the rotation and translation movement of the knee joint and compare the knee kinematics of handball player and non-athletes during treadmill walking with the preferred speed in a complete gait cycle. In this study subjects walked in treadmill as it allows ambulation within small area and facilitates the use of static camera and monitoring equipment (Alton, Baldey, Caplan & Morrissey, 1998). Preferred walking speed of the subject in our study in agreement with the study (Mohler, Thompson, Creem-Regehr, Pick & Warren, 2007).
We divided the walking in eight different events and seven different phases as illustrated in (Figure 1) and studied the knee movement in individual event. Division of walking in events and phases had made the study easier to understand the actual characteristics of knee move- ments in stance and swing phase of gait cycle. Rotational movement are presented in (Table 1, Figure 2, Figure 3 and Figure 4). Maximum values of rotational movement were observed in E6. Flexion and ex- tension of the knees were noticeable in E2, E5, E6 and E7. Previous studies (Gray et al., 2019) had reported two flexion and two extension peaks during the stance phase but the particular event was not described. However, in this study we had clearly explained the peaks in flexion and extension. Result of t-test in (Table 3) shows the comparison between means of rotational movement of two groups. Significant differences were found in ROM of internal and external rotational and max abduction and adduction between handball player and the non-athlete group. This may be the result of high load torsional activities such as cutting and pivoting during training and game play (Muaidi, Nicholson & Refshauge, 2009). Sports such as handball require a high-level coordination, postural control strength and flexibility associated with the lower extremity and knee is directly involved in such activities. While passing and receiving the ball, cutting movements and quick changes of direction are required at that time rotation of the leg is essential.
Translational movement are presented in (Table 2, Figure 5, Figure 6 and Figure 7). Maximum proximal translation was observed in E6 whereas distal translation was found maximum in E1 and E6. Distal translation was found higher in handball player than non-athletes. Posterior translation was found maximum in E5 for non-athletes and in E7 for handball player. Small difference was found in the medial /lateral translation in E1 and E8. In spite of differences in the trans- lation movement no significant difference was found during the statical analysis. The result of independent samples t-test in (Table 4) shows no significant difference for translation movement of tibia between the two groups of the study. The anterior posterior translation of the tibia with respect to femur in our study is found to be consistent with previous studies (Iwaki, Pinskerova & Freeman, 2000; Pinskerova et al., 2004), however in this study we are able to focus the movement at the particular event in the gait cycle which is one of the merit of this study. The magnitude of the overall translation are comparable Previous studies (Liu et al., 2021; Postolka et al., 2020) which has accessed to knee movements in six degree of freedom using motion capture system and fluoroscope. However, in the use of fluoroscope subjects have to get expose in the harmful radiation for the longer period of time.
Variety of approaches had been used to study the knee kinematics however in this study we approach to knee movement in 6 degrees of freedom with the use of motion capture system only. Further we studied the athletes and non-athletes' knee in different event of a complete gait cycle.
We calculate rotation and translation movement of knee during the complete gait cycle using motion capture system. Comparison of cal- culated movements between handball player and non-athletes shows Significant difference in the ROM of internal-external rotation and max abduction and adduction. Active involvement of handball players knee during game and training session may be the result of such difference. In this study dominant knee at a single speed was inves- tigated. The result of this study may not be applicable to other athletes rather than handball player. In order to understand the actual char- acteristic of knee motion future studies have to be done in different walking and running trial at variable speed.
References
1. Akbarshahi, M., Schache, A. G., Fernandez, J. W., Baker, R., Banks, S. & Pandy, M. G. (2010). Non-invasive assessment of soft-tissue artifact and its effect on knee joint kinematics during functional activity. Journal of Biomechanics, 43(7), 1292-1301.
Google Scholar
2. Almeida, G. P. L., Silveira, P. F., Rosseto, N. P., Barbosa, G., Ejnisman, B. & Cohen, M. (2013). Glenohumeral range of motion in handball players with and without throwing-related shoulder pain. Journal of Shoulder and Elbow Surgery, 22(5), 602-607.
Google Scholar
3. Alton, F., Baldey, L., Caplan, S. & Morrissey, M. (1998). A kinematic com- parison of overground and treadmill walking. Clinical Biomechanics, 13(6), 434-440.
Google Scholar
4. Andriacchi, T. P., Alexander, E. J., Toney, M., Dyrby, C. & Sum, J. A. (1998). A point cluster method for in vivo motion analysis: applied to a study of knee kinematics. Journal of Biomechanical Engineering, 120(6), 743-749.
Google Scholar
5. Clément, J., Toliopoulos, P., Hagemeister, N., Desmeules, F., Fuentes, A. & Vendittoli, P. A. (2018). Healthy 3D knee kinematics during gait: Differences between women and men, and correlation with x-ray alignment. Gait & Posture, 64, 198-204.
Google Scholar
6. Dennis, D., Komistek, R., Scuderi, G., Argenson, J. N., Insall, J., Mahfouz, M. ... & Haas, B. (2001). In vivo three-dimensional determination of kinematics for subjects with a normal knee or a unicompartmental or total knee replacement. JBJS, 83(2), S104-115.
Google Scholar
7. Gray, H. A., Guan, S., Thomeer, L. T., Schache, A. G., de Steiger, R. & Pandy, M. G. (2019). Three-dimensional motion of the knee-joint complex during normal walking revealed by mobile biplane x-ray imaging. Journal of Orthopaedic Research®, 37(3), 615-630.
Google Scholar
8. Iwaki, H., Pinskerova, V. & Freeman, M. (2000). Tibiofemoral movement 1: the shapes and relative movements of the femur and tibia in the unloaded cadaver knee. The Journal of Bone and Joint Surgery. British Volume, 82(8), 1189-1195.
Google Scholar
9. Komistek, R. D., Dennis, D. A. & Mahfouz, M. (2003). In vivo fluoroscopic analysis of the normal human knee. Clinical Orthopaedics and Related Research®, 410, 69-81.
Google Scholar
10. Koo, S. & Andriacchi, T. P. (2008). The knee joint center of rotation is predominantly on the lateral side during normal walking. Journal of Biomechanics, 41(6), 1269-1273.
Google Scholar
11. Kozanek, M., Hosseini, A., Liu, F., Van de Velde, S. K., Gill, T. J., Rubash, H. E. & Li, G. (2009). Tibiofemoral kinematics and condylar motion during the stance phase of gait. Journal of Biomechanics, 42(12), 1877-1884.
Google Scholar
12. Levine, D., Richards, J. & Whittle, M. W. (2012). Whittle's Gait Analysis-E-Book: Elsevier health sciences.
Google Scholar
13. Liu, R., Qian, D., Chen, Y., Zou, J., Zheng, S., Bai, B. ... & Chen, Y. (2021). Investigation of normal knees kinematics in walking and running at different speeds using a portable motion analysis system. Sports Biomechanics, 1-14.
Google Scholar
14. Michalsik, L. B., Aagaard, P. & Madsen, K. (2015). Technical activity pro- file and influence of body anthropometry on playing performance in female elite team handball. The Journal of Strength & Con- ditioning Research, 29(4), 1126-1138.
Google Scholar
15. Mohler, B. J., Thompson, W. B., Creem-Regehr, S. H., Pick, H. L. & Warren, W. H. (2007). Visual flow influences gait transition speed and preferred walking speed. Experimental Brain Research, 181(2), 221-228.
Google Scholar
16. Muaidi, Q., Nicholson, L. & Refshauge, K. (2009). Do elite athletes exhibit enhanced proprioceptive acuity, range and strength of knee rotation compared with non-athletes? Scandinavian Journal of Medicine & Science in Sports, 19(1), 103-112.
Google Scholar
17. Pinskerova, V., Johal, P., Nakagawa, S., Sosna, A., Williams, A., Gedroyc, W. & Freeman, M. (2004). Does the femur roll-back with flexion? The Journal of Bone and Joint Surgery. British Volume, 86(6), 925-931.
Google Scholar
18. Postolka, B., Schütz, P., Fucentese, S. F., Freeman, M. A., Pinskerova, V., List, R. & Taylor, W. R. (2020). Tibio-femoral kinematics of the healthy knee joint throughout complete cycles of gait activities. Journal of Biomechanics, 110, 109915.
19. Van Mechelen, W. (1992). Running injuries. Sports Medicine, 14(5), 320-335.
Google Scholar